Public involvement is an essential part of health and social care research.
Involving members of the public in the design and delivery of research has been shown to improve its quality, impact and make it easier to recruit future participants.
As part of the Health Research Authority’s strategy for 2025-2028 we have set out to increase the rates of meaningful public involvement in research.
We hope to achieve this by setting shared expectations across the research system and making it simpler for researchers to find out how to do research with and for everyone.
To measure the impact of our collective efforts to improve the extent and quality of public involvement across the research sector, every year we analyse a sample selection of applications receiving a favourable opinion from a Research Ethics Committee (REC) to see if the research had involved members of the public.
What we did
In 2024, 3,764 studies received REC favourable opinion and we analysed just over 10% (400) of these studies.
We looked at the percentage of applicants who stated that they had actively involved, or would involve patients, service users and their carers, or members of the public in their research.
We also looked at which aspects of the research process applicants stated they had actively involved the public in as indicated in the IRAS application form.
Finally, we looked at any differences between commercial and non-commercial studies as well as clinical trial and non-clinical trial studies.
Summary of our findings
When analysing data from studies receiving a REC favourable opinion in 2024, we found that:
- the percentage of applicants reporting that they had, or would, actively involve the public in their research was 84%
- public involvement was less common in commercial studies – 64% compared to 91% of non-commercial studies
- public involvement was less common in clinical trials – 64% compared to 89% of non-clinical trials
- when we looked at areas where members of public were involved, 85% were in the design of the research and 67% in dissemination of findings
Below we break down our findings in more detail.
Comparison between data from 2023 and 2024
This is the second year that we have published data on public involvement in research.
You can take a look at a detailed analysis of the changes between 2023 and 2024 in our news story.
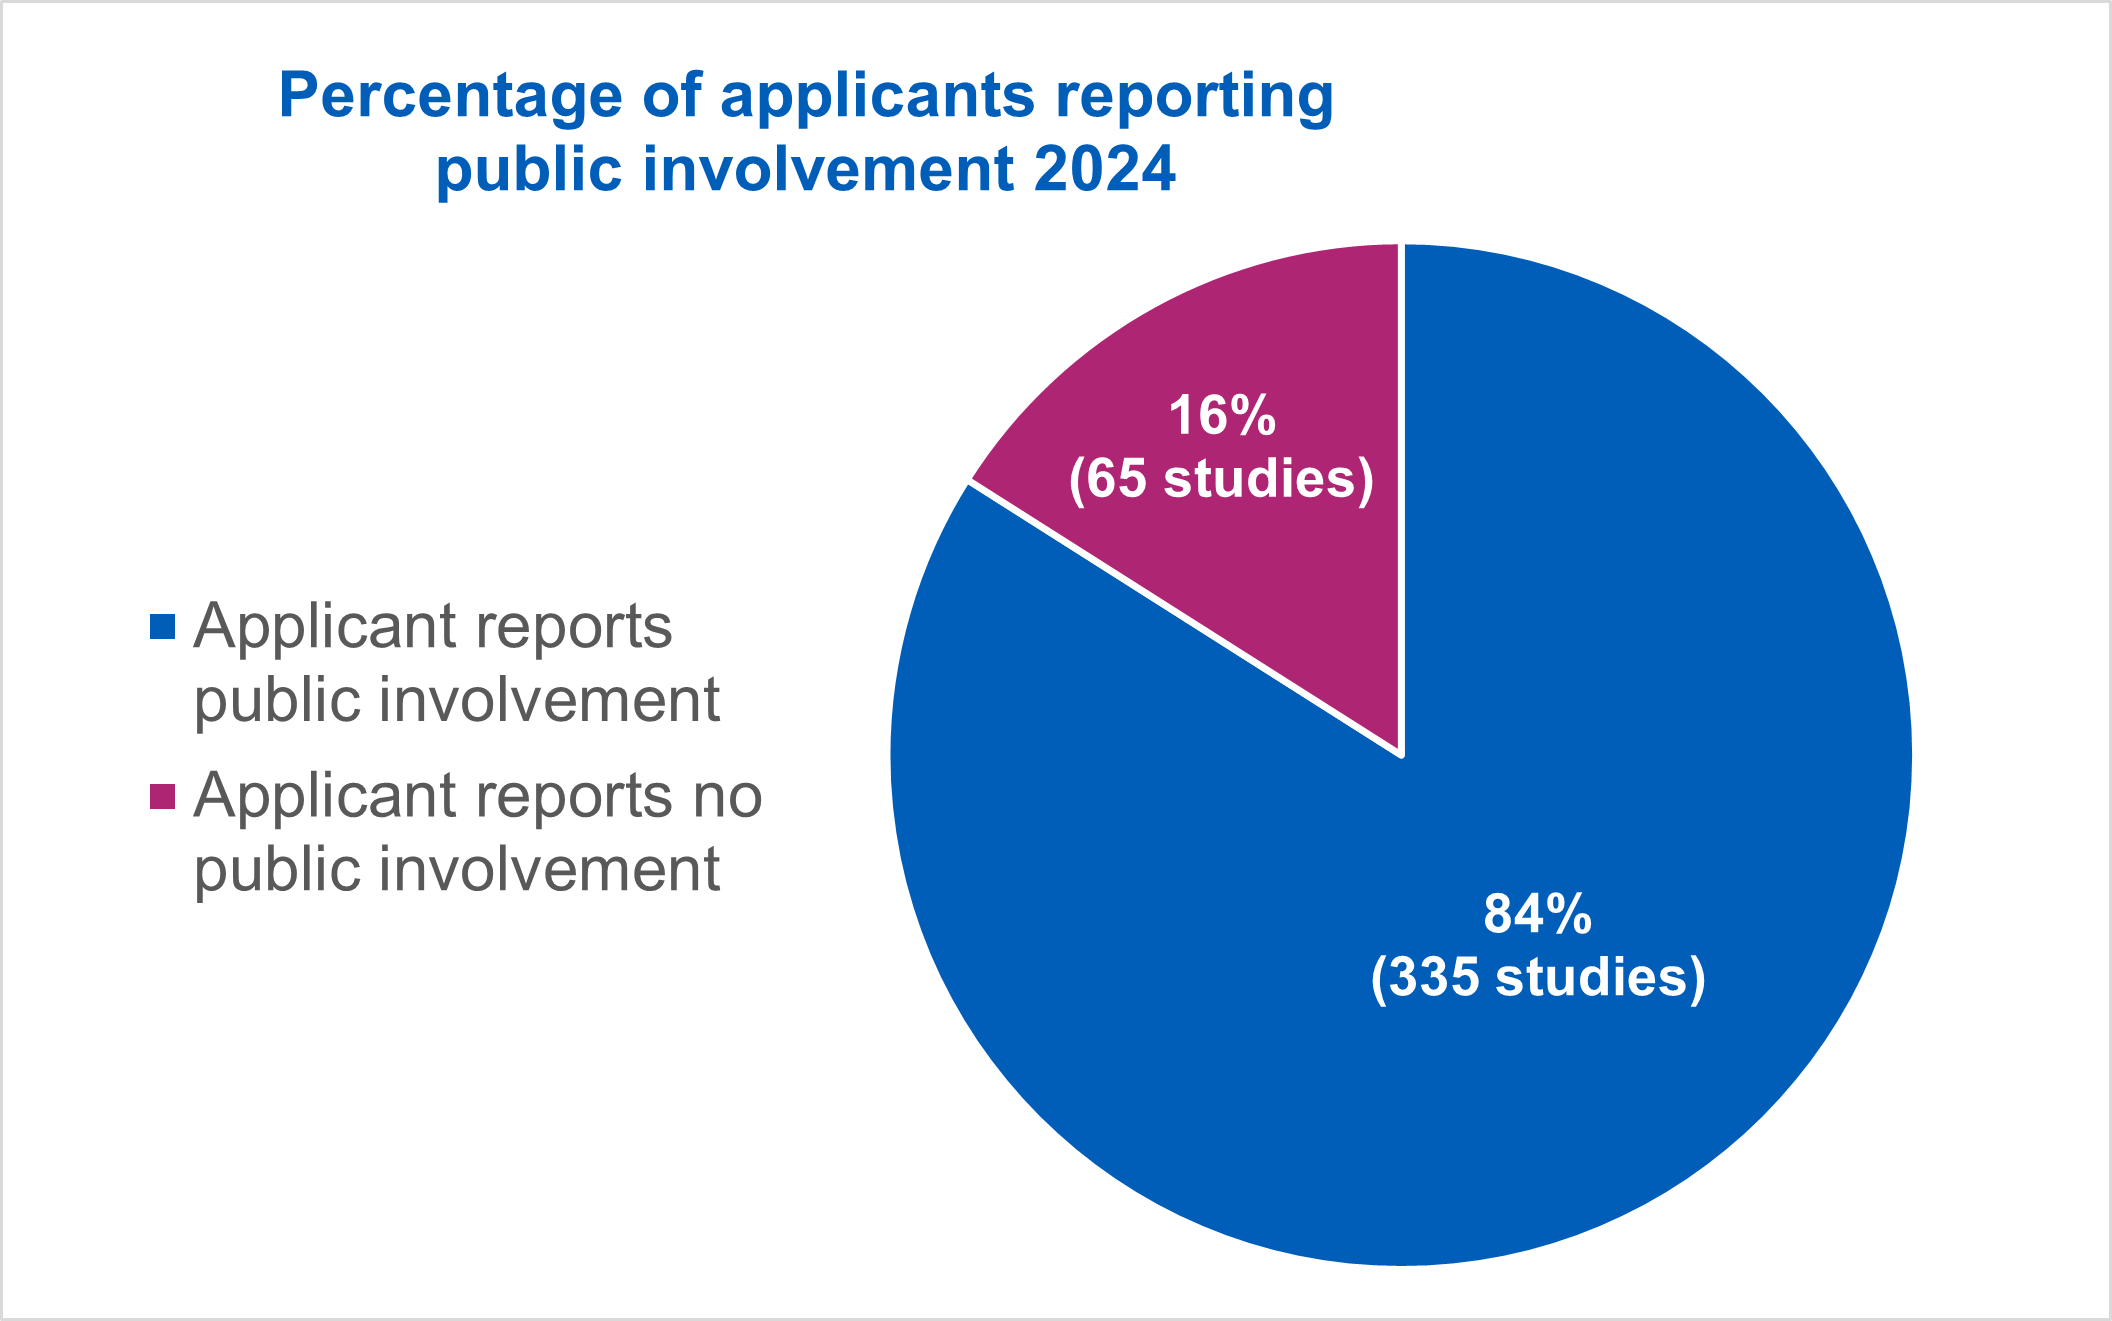
Overall public involvement
Of the 400 studies that we analysed, 335 (84%) applicants reported public involvement in their study.
65 (16%) studies reported no public involvement in their study.
| Public involvement breakdown | Total number of applications | Percentage of studies (%) |
| Application reports public involvement | 335 | 84% |
| Application reports no public involvement | 65 | 16% |
| Total | 400 | 100 |
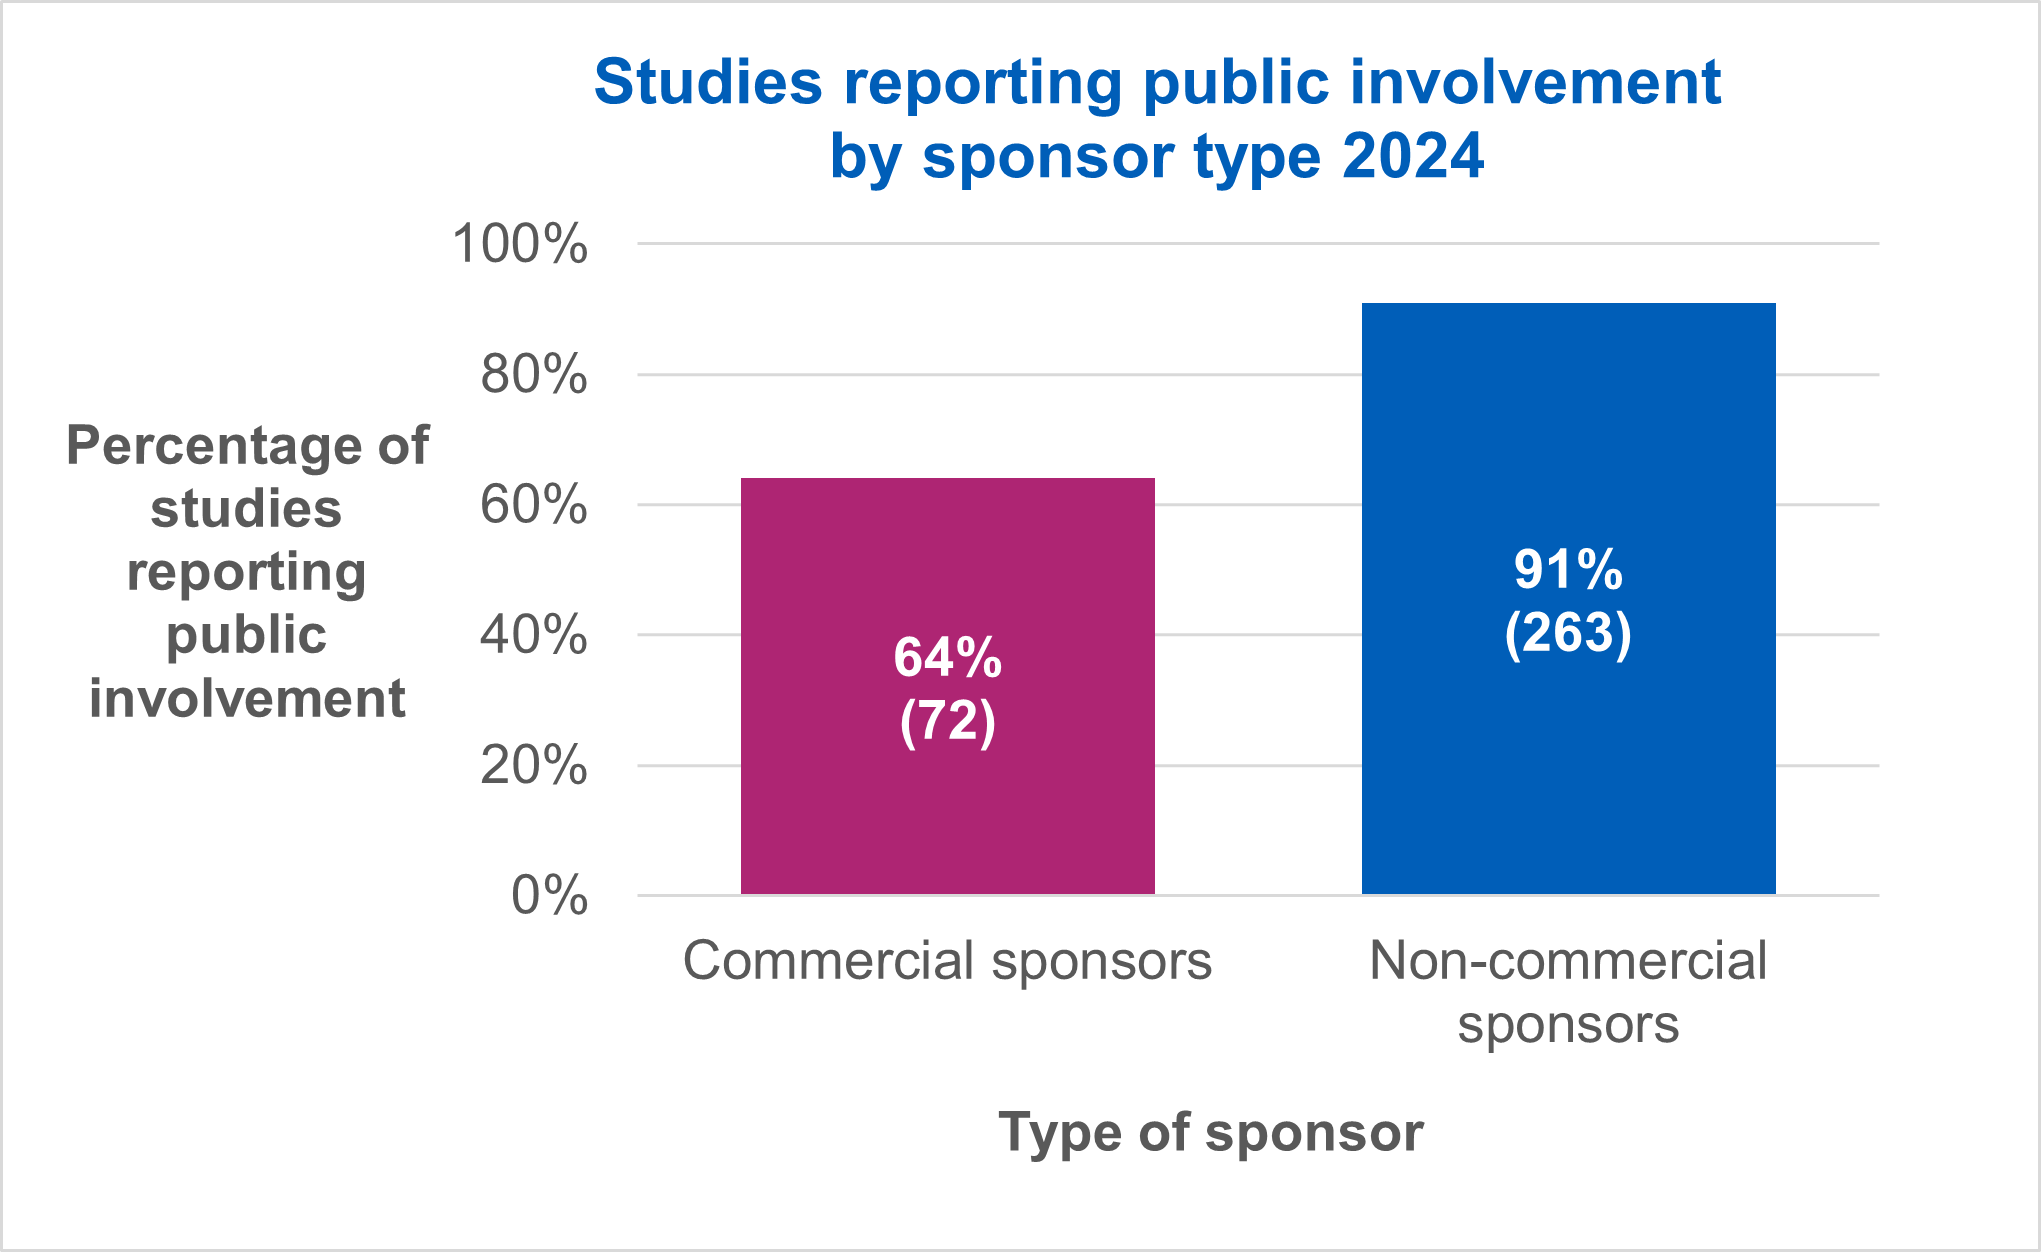
Public involvement in commercial and non-commercial studies
This section focuses on the level of public involvement by the type of sponsor carrying out research.
We looked at the numbers and percentages of commercial and non-commercial sponsors who said yes to public involvement in their application.
Of the 400 applications we analysed, 112 were commercial studies and 288 were non-commercial studies.
When looking at commercial studies, 72 of the 112 (64%) reported public involvement, compared to 263 of the 288 (91%) for non-commercial studies.
| Sponsor type | Total number of applications | Applications reporting public involvement | Percentage of studies (%) |
| Commercial sponsors | 112 | 72 | 64% |
| Non-commercial sponsors | 288 | 263 | 91% |
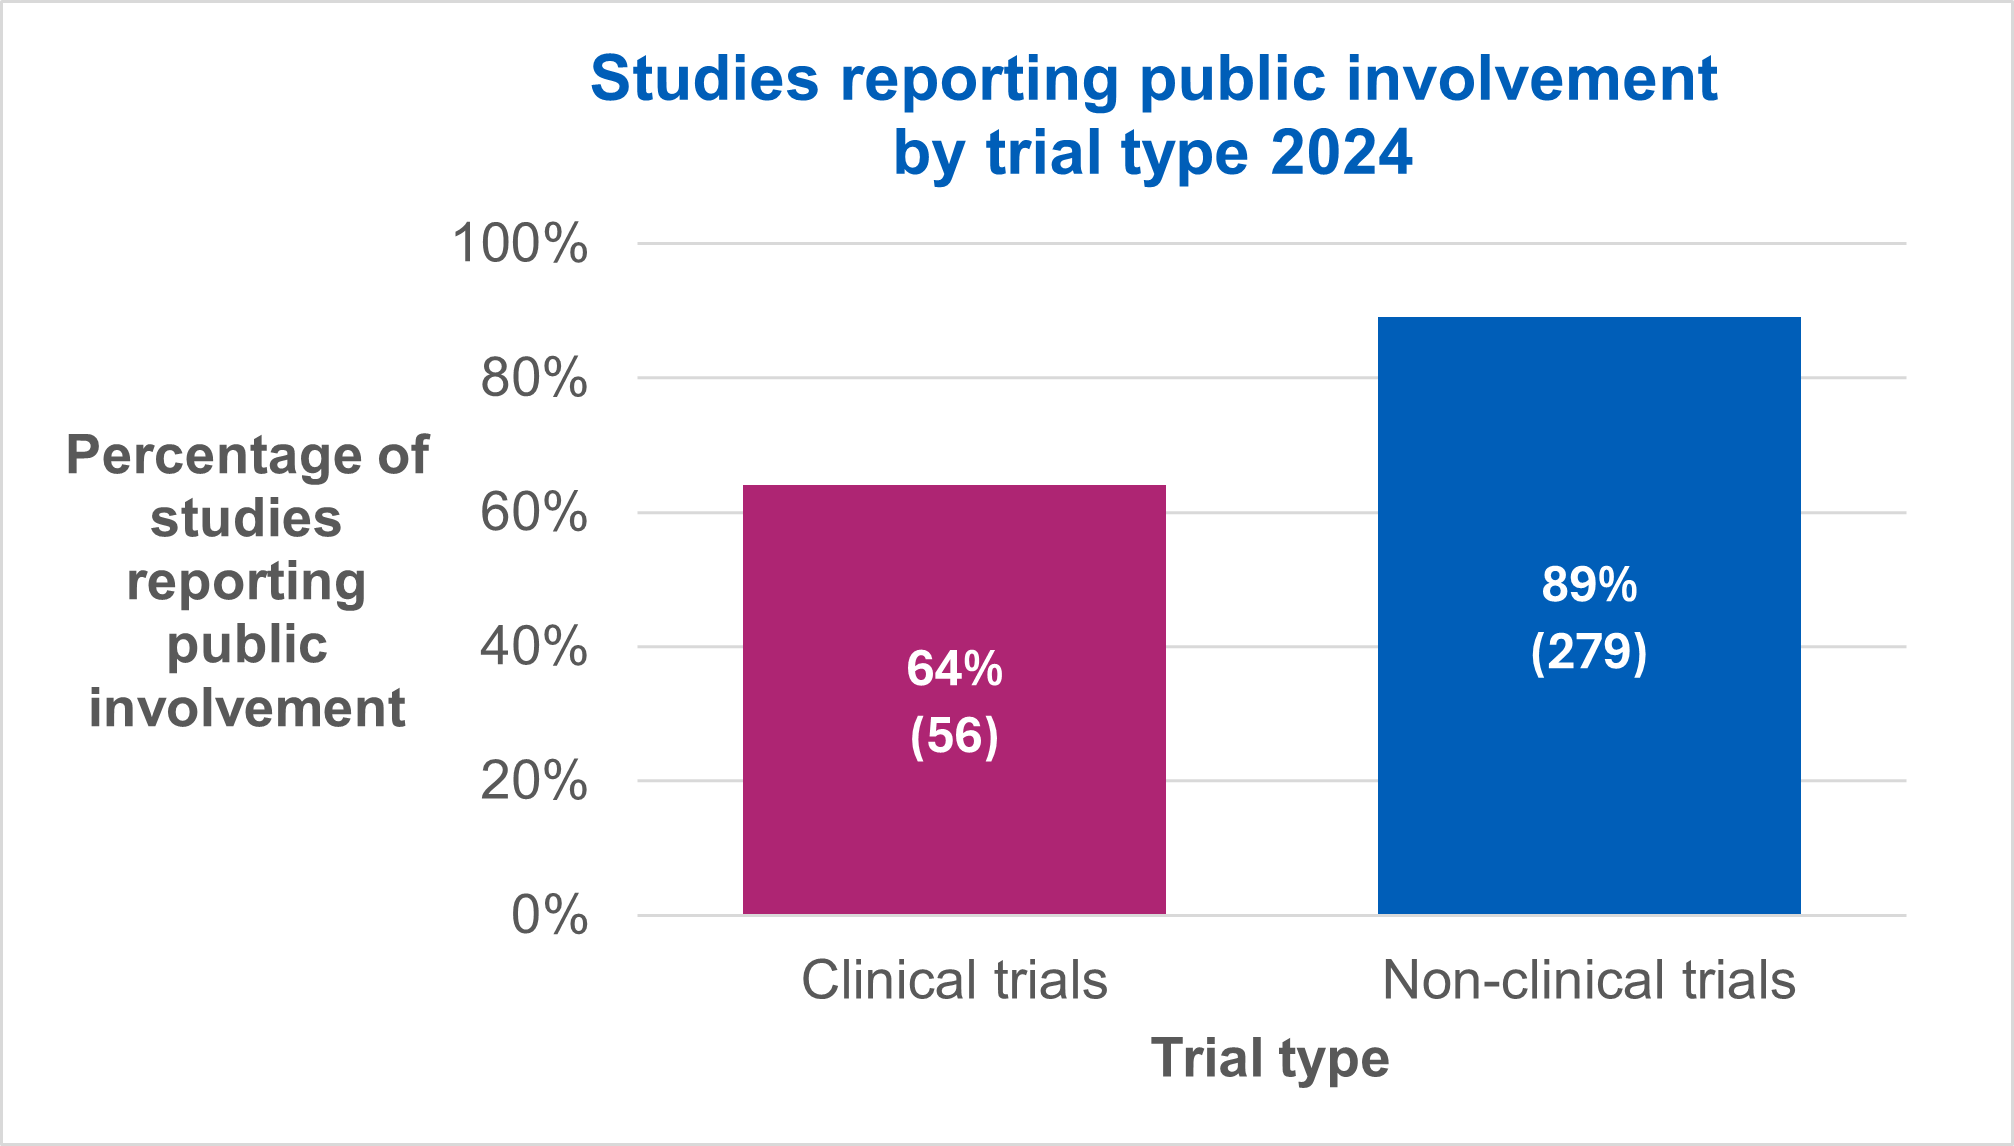
Public involvement in clinical trials and non-clinical trials
This section focuses on the level of public involvement by what type of trial it was.
We looked at the numbers and percentages of clinical and non-clinical trials where the applicant said yes to public involvement in their application.
Of the 400 applications we analysed, 114 were clinical trials and 284 were non-clinical trials.
When looking at clinical trials, 61 of the 114 (54%) clinical trials reported public involvement, compared to 235 of the 284 (83%) non-clinical trials.
| Type of study | Total number of applications | Applications reporting public involvement | Percentage (%) |
| Clinical trials | 87 | 56 | 64 |
| Non-clinical trials | 313 | 279 | 89 |
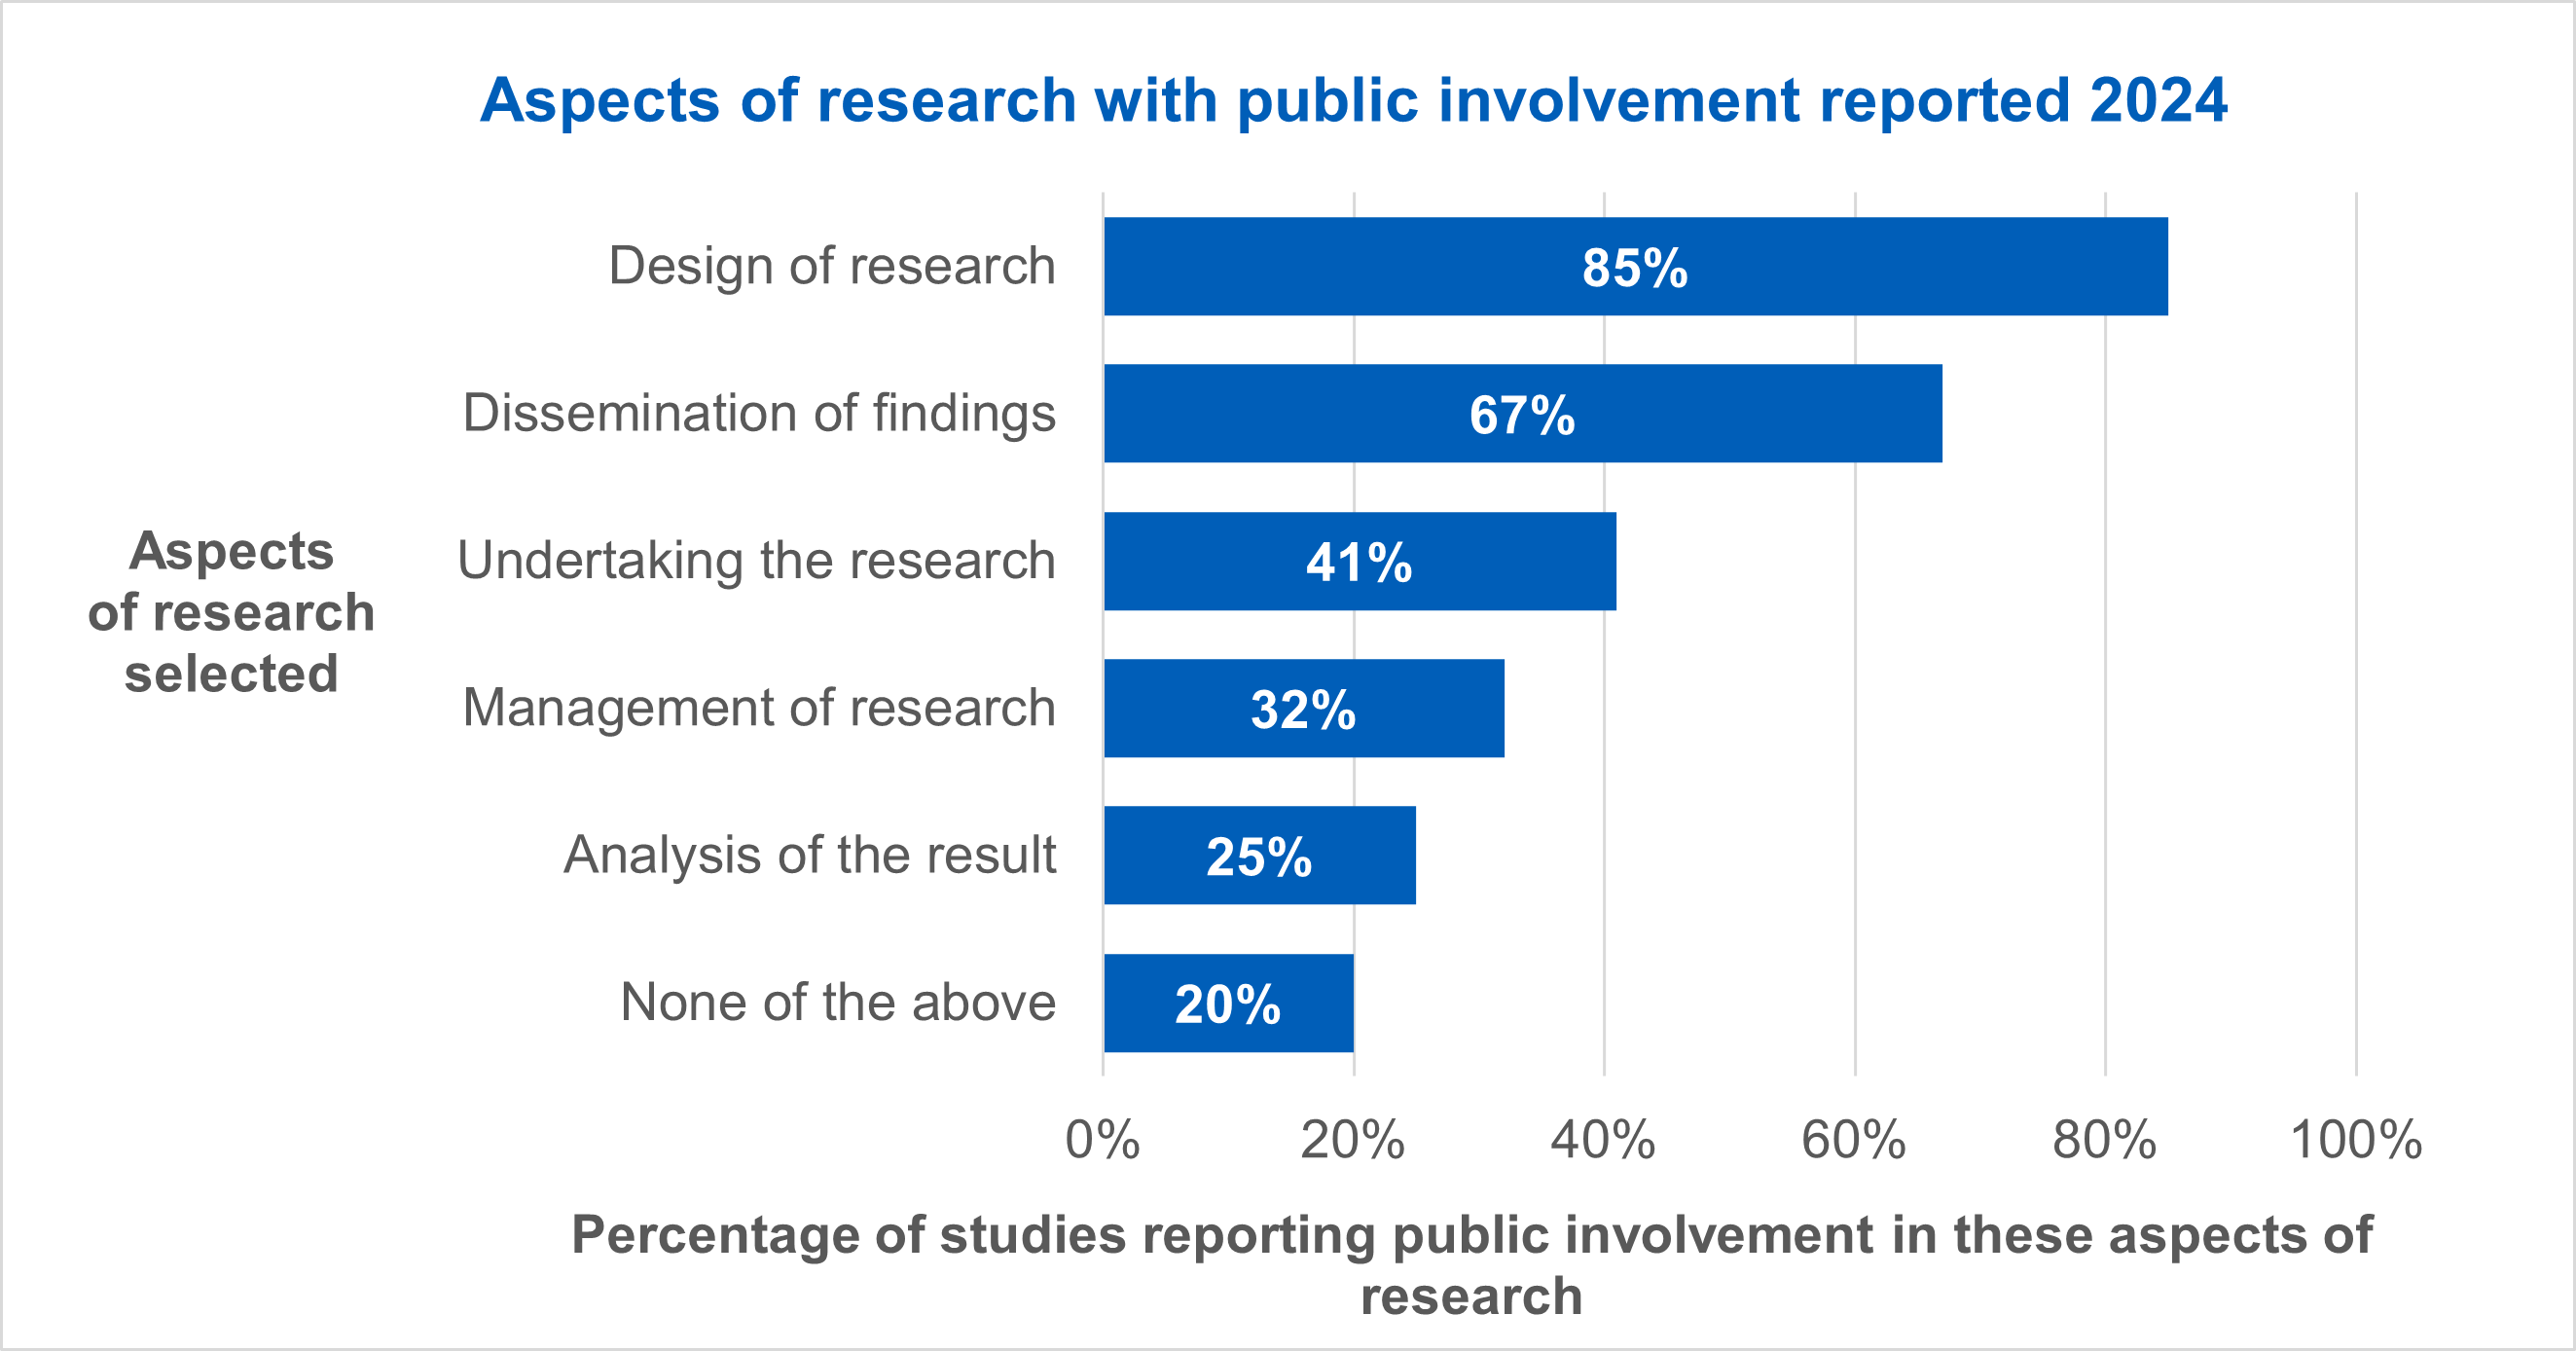
Public involvement in different aspects of research
335 of the 400 studies we analysed reported public involvement in their applications.
From these applications we looked at the different stages of research, and where applications had reported public involvement at that stage.
We have defined the different stages of research as:
- design of the research
- management of the research
- undertaking the research
- analysis of the result
- dissemination of findings
Where a study did not report public involvement in any of these stages we have marked as ‘none of the above’ as seen in the table below.
| Aspects of research with public involvement breakdown | Total number of applications that selected these aspects | Percentage of applications that selected these aspects (%) |
| Design of the research | 286 | 85 |
| Management of the research | 107 | 32 |
| Undertaking the research | 138 | 41 |
| Analysis of the result | 85 | 25 |
| Dissemination of findings | 224 | 67 |
| None of the above | 66 | 20 |