Every year we review the data that we hold for research applications that have been submitted to a Research Ethics Committee (REC) for review.
One of the key things we look for is whether the applicants told us they have involved members of the public in their research.
Ensuring that researchers meaningfully involve members of the public in research is something that we’ve prioritised as part of our strategy for 2025-2028.
We hope to achieve this by making our expectations for public involvement clear, and making it easier for researchers to find out how to do it.
To measure this we have analysed a sample of applications that received a favourable opinion from a REC to see if they told us they had involved members of the public.
What we did
In 2025, 3,801 studies received a favourable opinion from a REC. We drew a proportionate sample to reflect the distribution of study types in the full dataset and analysed a sample of 416 studies, representing around 11%.
We looked at the percentage of applicants who stated that they had actively involved, or would involve patients, service users and their carers, or members of the public in their research.
We also looked at which aspects of the research process applicants stated they had actively involved the public in as indicated in the IRAS application form.
Finally, we looked at any differences between commercial and non-commercial studies as well as clinical trial and non-clinical trial studies.
Summary of our findings
When analysing data from studies receiving a REC favourable opinion in 2025, we found that:
- 84% of applicants reported that they had, or would, actively involved the public in their research
- public involvement was less common in commercial studies (69%) compared to non-commercial studies (92%)
- public involvement was more common in clinical trials (88%) compared to non-clinical trials (83%)
- 76% of members of the public were involved in the design of research, with 50% involved in the sharing of the findings
Below we break down our findings in more detail.
Overall public involvement
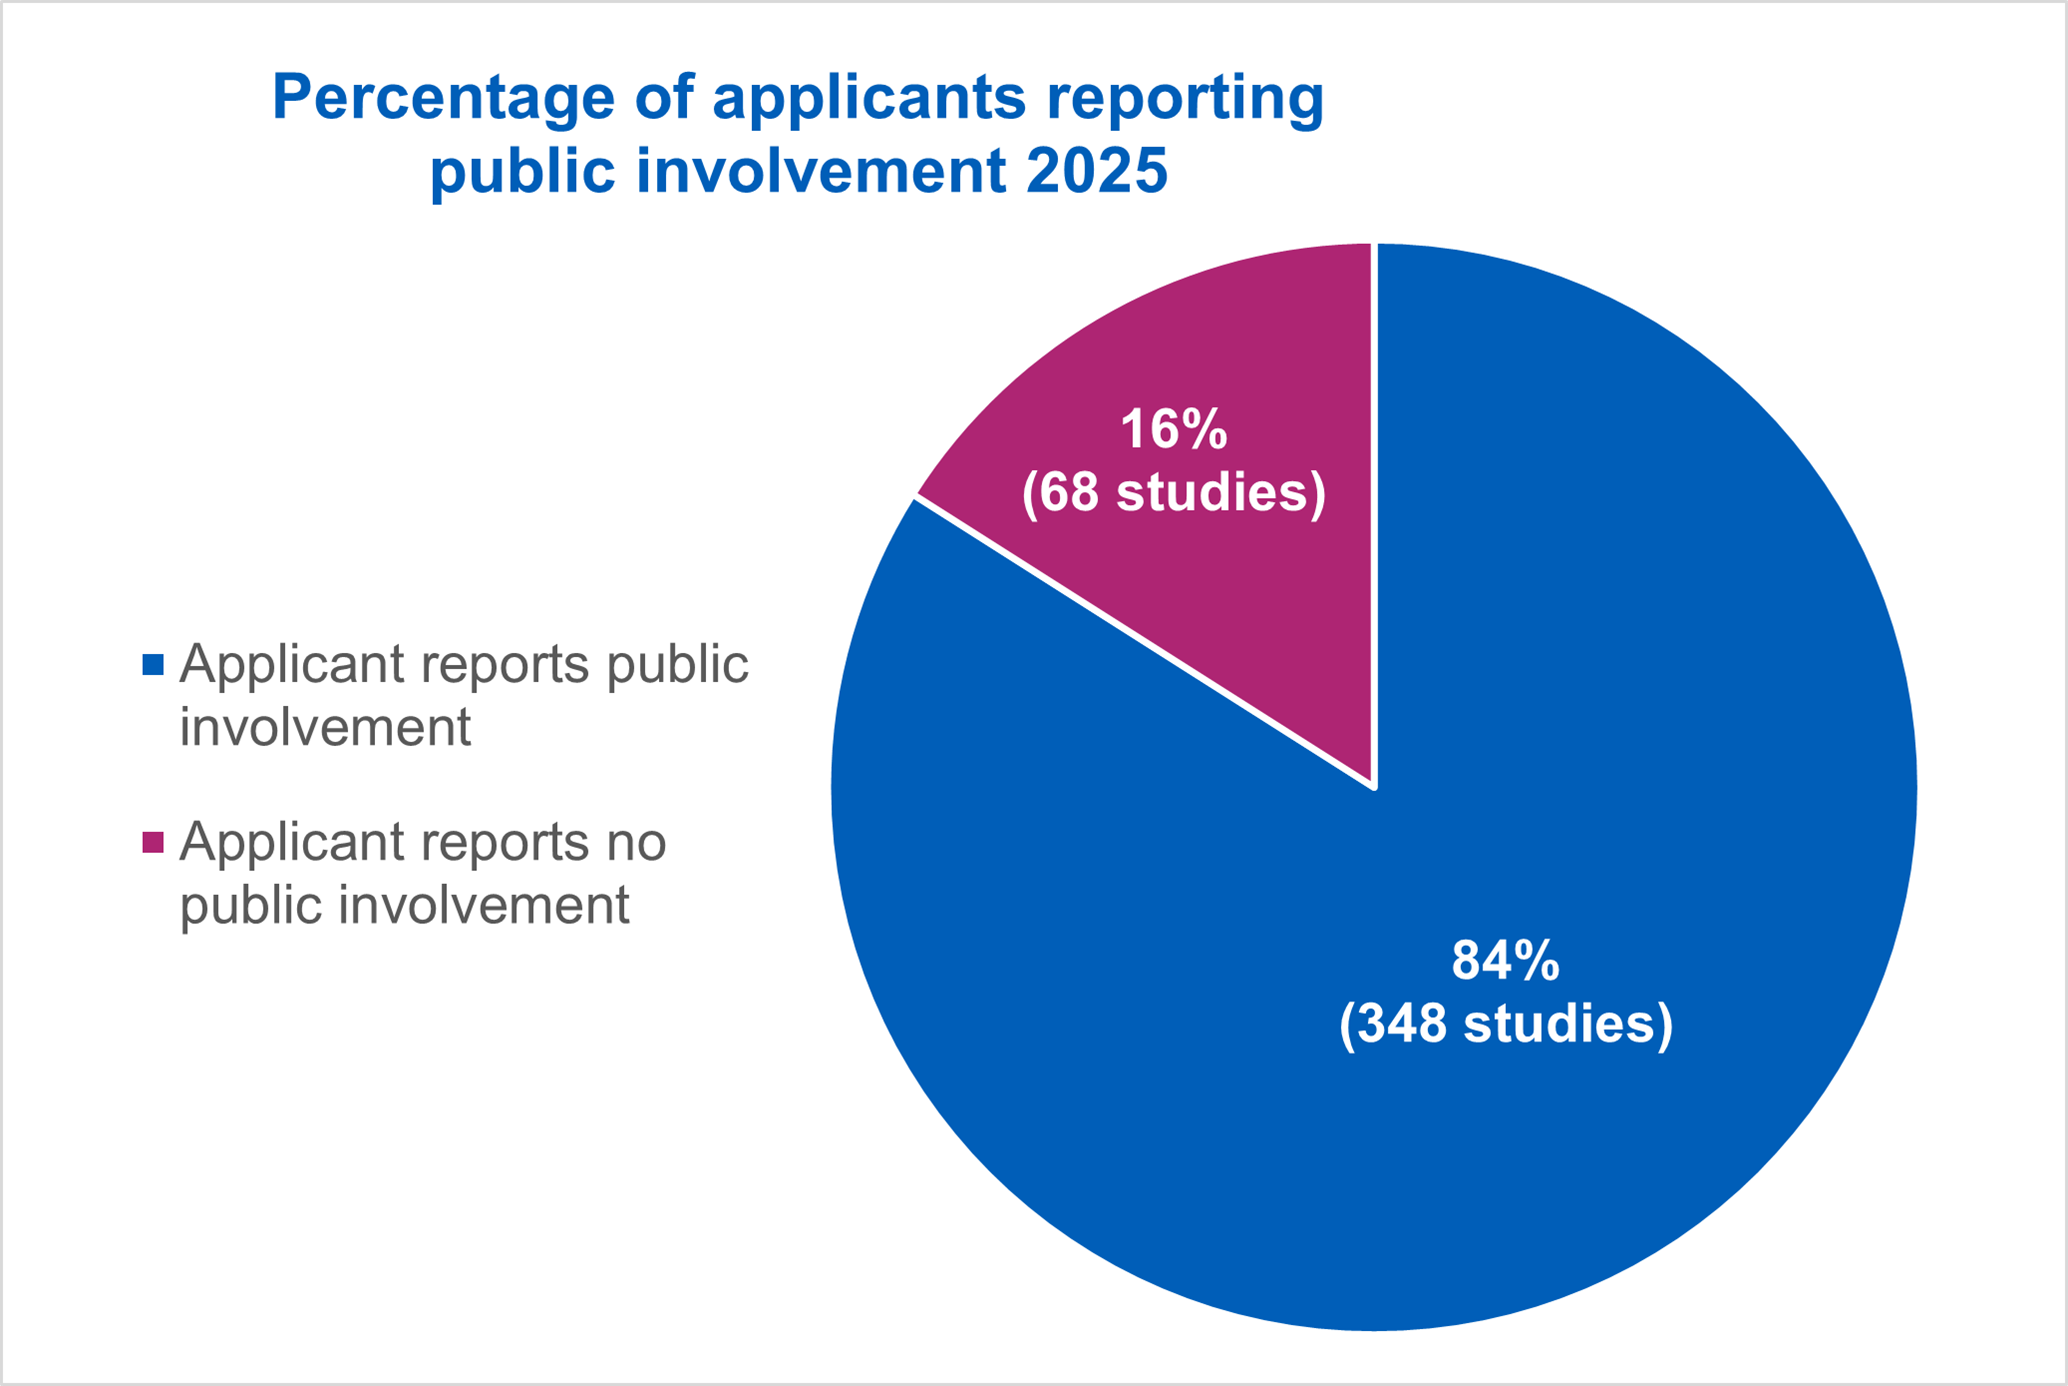
Of the 416 studies that we analysed, 348 (84%) applicants reported public involvement in their study.
68 (16%) studies reported no public involvement in their study.
Commercial and non-commercial studies
This section focuses on the level of public involvement by the type of sponsor carrying out research.
We looked at the numbers and percentages of commercial and non-commercial sponsors who said yes to public involvement in their application.
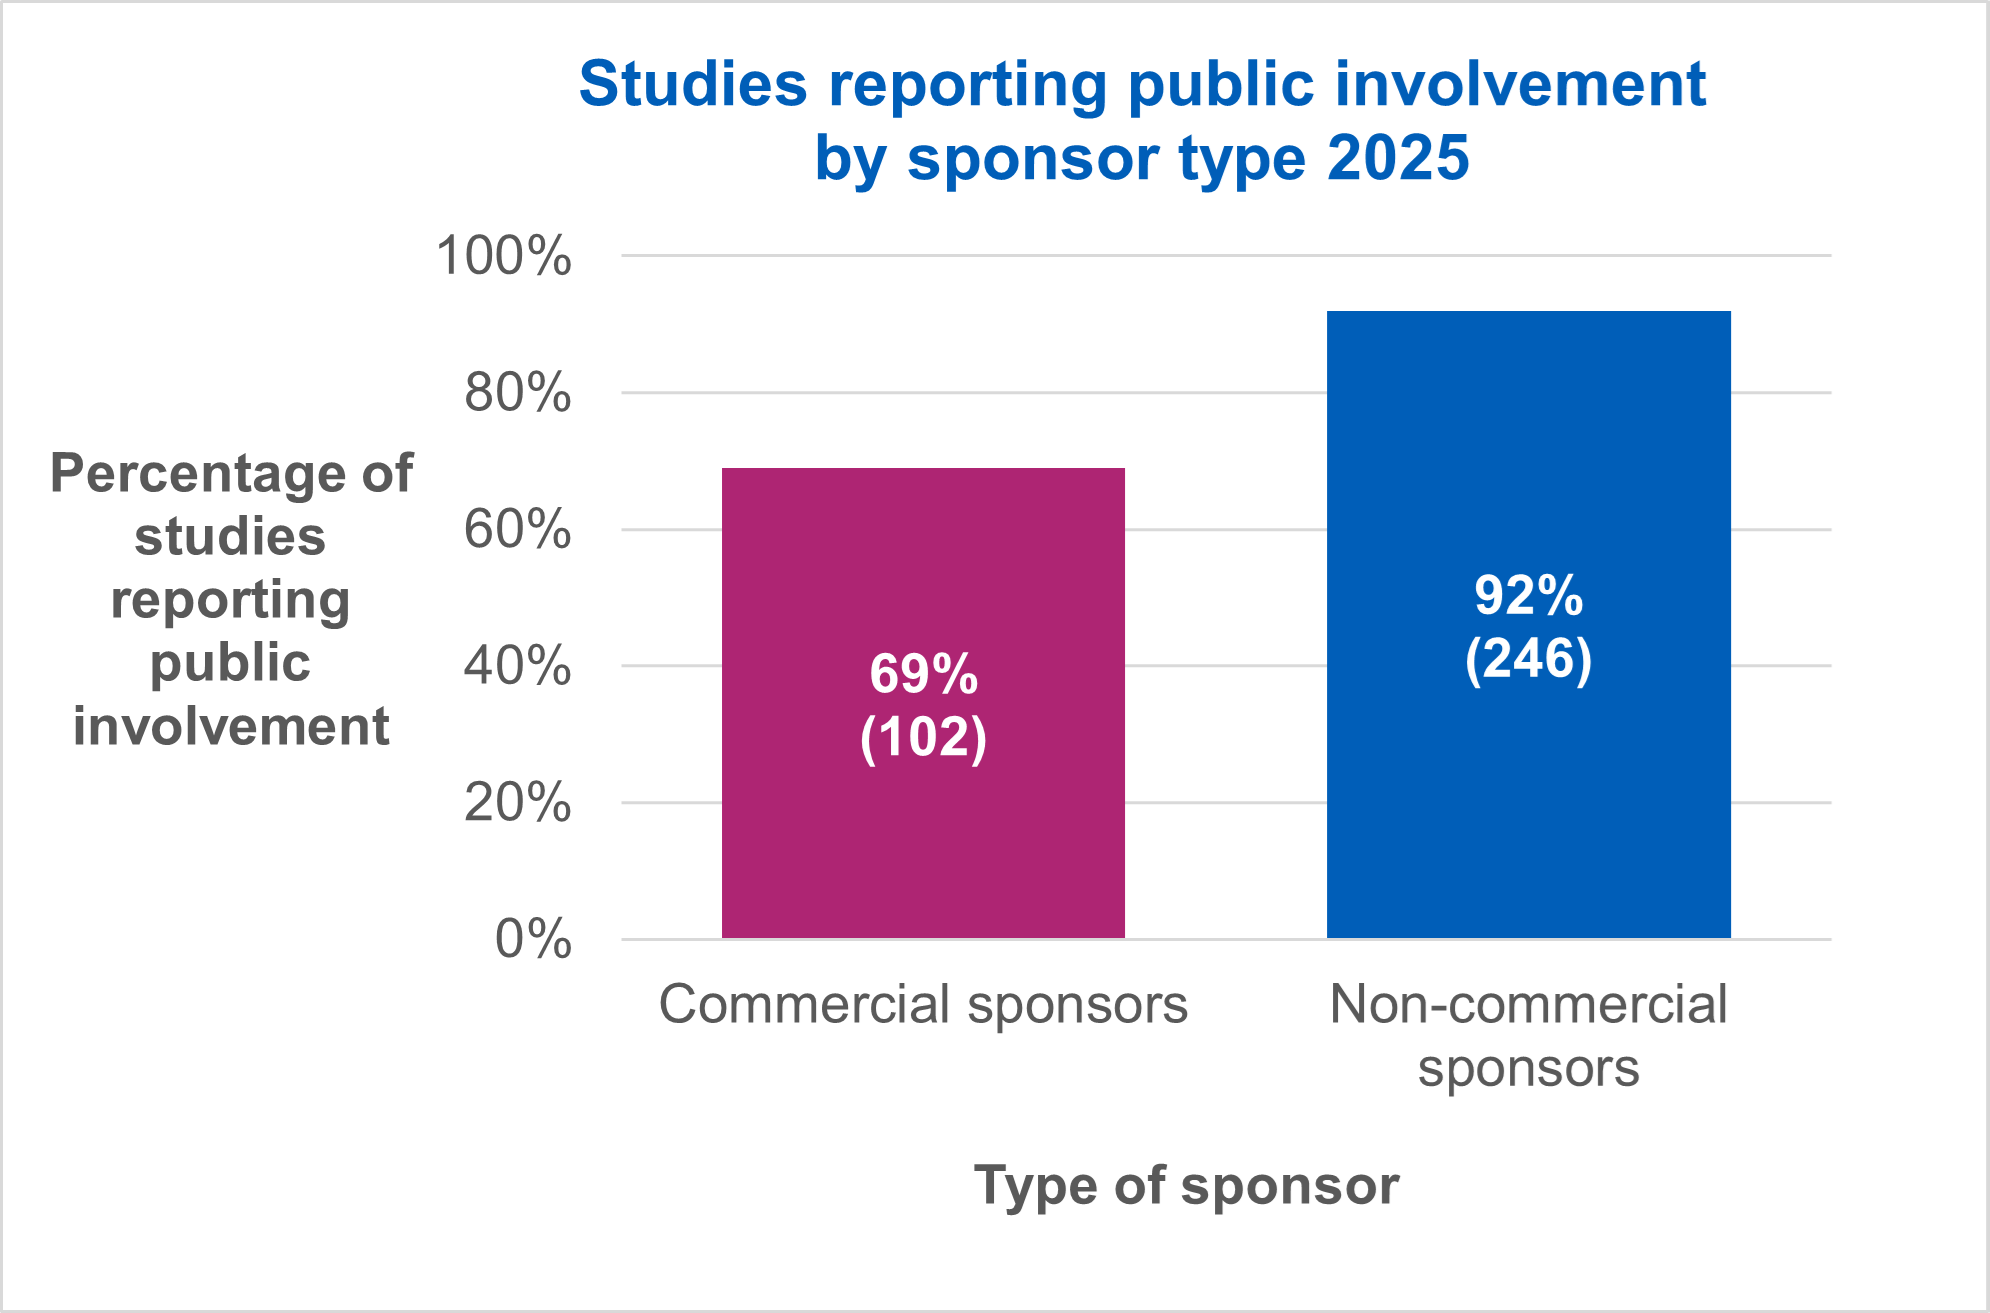
Of the 416 applications we analysed, 148 were commercial studies and 268 were non-commercial studies.
When looking at commercial studies, 102 of the 148 (69%) reported public involvement, compared to 246 of the 268 (92%) for non-commercial studies.
Clinical trials and non-clinical trials
This section focuses on the level of public involvement by what type of study it was.
We looked at the numbers and percentages of clinical and non-clinical trials where the applicant said yes to public involvement in their application.
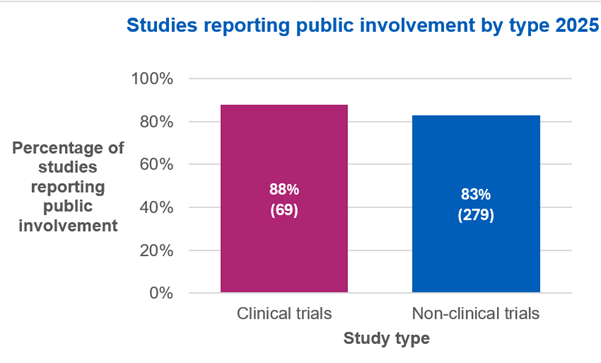
Of the 416 applications we analysed, 78 were clinical trials and 338 were non-clinical trials.
When looking at clinical trials, 69 of the 78 (88%) reported public involvement, compared to 279 of the 338 (83%) non-clinical trials.
Public involvement in different aspects of research
348 of the 416 studies we analysed reported public involvement in their applications.
From these applications we looked at the different stages of research, and where applications had reported public involvement at that stage.
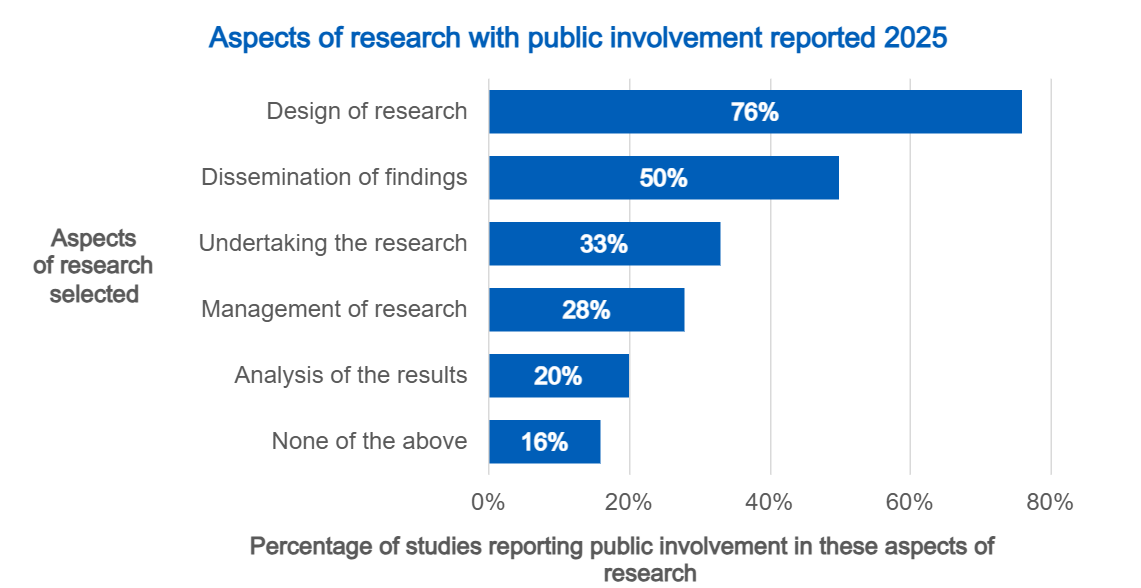
In the IRAS application form we define the stages of research and ask applicants whether they involve members of the public at each stage. The figures show the number of applications reporting this involvement:
- design of the research - 317 (76%)
- management of the research - 116 (28%)
- undertaking the research - 137 (33%)
- analysis of the results - 85 (20%)
- dissemination of findings - 206 (50%)
- none of the above – 67 (16%)
Where a study did not report public involvement in any of these stages we have marked it as ‘none of the above’.
Comparison of data from 2023, 2024 and 2025
This is the third year that we have published data on public involvement in research.
You can take a look at a detailed analysis of the changes between 2023, 2024 and 2025 in our news story.